Project 1: Beta and Return.
The objectives of this exercise:
- To access and download stock and index price data from yahoo.com.
- To discern the difference between a real-time closing price and an adjusted closing price.
- To discover how yahoo.com calculates beta for an individual stock.
- To replicate the yahoo.com calculation for four firms in the S&P 500 index, tabulate the results, and report your findings.
Learning Outcomes:
Students should be able to:
- Identify individual stocks in the S&P 500 index and discuss the composition of the S&P 500 index.
- Collect financial data including closing stock prices and adjusted closing stock prices.
- Estimate beta from historical data.
- Tabulate regression results and discuss empirical findings.
Guidelines:
- You can use your 4 stocks selected for the 3-Factor Project project(I HAVE ORDERED ANOTHER ASSIGNMENT WHICH IS CALLED FAMA FRENCH 3 FACTOR- YOU CAN USE THE SAME 4 STOCKS FOR THIS AS WELL): for these 4 stocks (or, more precisely, the ticker symbols) download data from yahoo.com. Go to yahoo.com, then Finance, then type in your ticker symbol. Next, choose Historical Prices from the tabs on the left. Tag “Monthly” then choose the appropriate dates (to be determined below). Click Get Prices, scroll to the bottom of the page, and download to a spreadsheet (it is actually saved as a ‘.csv’ file, but it will open okay in Excel).
a. The beginning month of the data should be December of 2014 or 60 months of data, you will need to download data from November 2015 through December 2020, once you calculate the monthly returns, you may discard November 2015. The first month of your data should be Dec. 2015 (excel download may show 1/1/2015) and the last month of return data should be December 1, 2020.
b. Be sure to use end-of-month data! Yahoo might print a beginning of month date in the monthly output, but it should be the end of the month. To check this, look at the daily data and verify that the last day of the month is used in the monthly spreadsheet (it should be if you wait until after the sample period to collect your data).
2. You must determine how exactly yahoo.com calculates historical beta, then replicate their calculations. This requires the use of regression software (or functions in Excel, if you know how to do that). Note, you must calculate returns first. Is the data sorted correctly – in time order? If not, you must sort your stock prices and market prices so that the oldest prices are first, then calculate returns. Answer the following questions:
a. How, exactly, does yahoo.com calculate its beta? How many months of return data do they use? How many months of price data do you need? How do you know that you and Yahoo used the same data period?
b. Should you use closing price or adjusted price when calculating returns? Why?
c. What is the market proxy? What ticker did you use for your market proxy?
3. Guideline #3: After calculating returns for your stocks and the market, you must calculate beta for each of your stocks. Create a Table showing the following: Ticker, Company Name, yahoo beta, calculated beta, intercept, and r-square from your regressions.
4. Do your regression results match yahoo.com results? Why or why not?
Output:
You must submit a brief write-up of your results. Your paper should be detailed enough so that someone else could pick up your paper and replicate your results. So, you will need a brief introduction describing your data sources, how you manipulated the data, how you calculated returns, how you calculated beta, a Table, and a brief summary and discussion of your findings. In total, you must submit:
a. Your write-up, as a Word file, including the Table, described above in Guideline #3 and your answers to the various questions.
b. An Excel spreadsheet (one sheet), properly formatted, containing the ticker symbol, closing price, adjusted price, and dates (dates should be the same for each ticker) for each of your twenty stocks and your market proxy.
c. Another Excel spreadsheet, properly formatted, detailing how, exactly, you calculated the results in your Table (i.e., replicate the detailed findings for your stocks). The two Excel worksheets should be in one file with two different labeled worksheet tabs. Alternatively, you may use multiple Excel sheets named with the ticker symbol if you wish to combine the date, ticker symbol, closing price, adjusted closing price, and calculations and/or regressions separately for each of your 4 companies.
Requirements: 4-5 PAGES
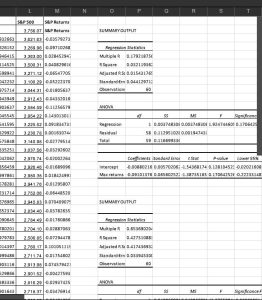
Returns Beta Regression Analysis 4 stock